If you are debugging a ASP.NET web application which is hosted on
IIS, you need to attach the particular worker process in Visual Studio
to start debugging. To Attach a process we can go to Tools > Attach Process or use shortcut key Ctrl +P. The process window will show the worker process (w3wp.exe) which is currently running on IIS. You need to select the process and click on attach button to start the debugging.
Problem starts when you have multiple worker process running on IIS. If you have multiple sites hosted on IIS and each site having their own application pool then you will see the list of all worker process in the Process Attach window.
Here you need to identify the particular worker process which is associated with your application pool.
Note: Whenever we create a new Application Pool, the ID of the Application Pool is being generated and it’s registered with the HTTP.SYS (Kernel Level of IIS) . So whenever HTTP.SYS Received the request from any web application, it checks for the Application Pool and based on the application pool it send the request
To know more about IIS Request Process, here is one of my aticle How IIS Process ASP.NET Request
Identify Worker Process in IIS 6.0
• Start > Run > Cmd
• Go To Windows > System32
• Run cscript iisapp.vbs
• You will get the list of Running Worker ProcessID and the Application Pool Name.
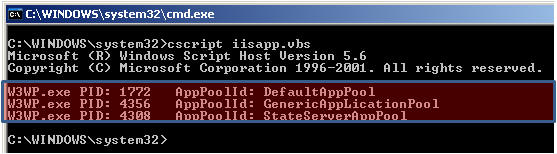
So, here is your list of all worker process with corresponding application pool name. From the Application pool name you can easily identify which worker process is related with your application.
Identify Worker Process in IIS 7.0
From IIS 7.0 you need you to run IIS Command Tool ( appcmd ) .
• Start > Run > Cmd
• Go To Windows > System32 > Inetsrv
• Run appcmd list wp
This will show you list worker process that is running on IIS 7.0 in the similar format of IIS 6.0
Original Post:
Problem starts when you have multiple worker process running on IIS. If you have multiple sites hosted on IIS and each site having their own application pool then you will see the list of all worker process in the Process Attach window.
Here you need to identify the particular worker process which is associated with your application pool.
Note: Whenever we create a new Application Pool, the ID of the Application Pool is being generated and it’s registered with the HTTP.SYS (Kernel Level of IIS) . So whenever HTTP.SYS Received the request from any web application, it checks for the Application Pool and based on the application pool it send the request
To know more about IIS Request Process, here is one of my aticle How IIS Process ASP.NET Request
Identify Worker Process in IIS 6.0
• Start > Run > Cmd
• Go To Windows > System32
• Run cscript iisapp.vbs
• You will get the list of Running Worker ProcessID and the Application Pool Name.
So, here is your list of all worker process with corresponding application pool name. From the Application pool name you can easily identify which worker process is related with your application.
Identify Worker Process in IIS 7.0
From IIS 7.0 you need you to run IIS Command Tool ( appcmd ) .
• Start > Run > Cmd
• Go To Windows > System32 > Inetsrv
• Run appcmd list wp
This will show you list worker process that is running on IIS 7.0 in the similar format of IIS 6.0
Original Post:
No comments:
Post a Comment